


ロータリースリッターナイフは見積書の上では小さな品目に見えますが、それが及ぼす影響、すなわち「刃物交換(段取り換え)時間、スクラップ率、バリの修正工数、そしてラインがコイル1巻全体を通じて公差を維持できるか否か」をコストモデル化すると、その重要性が浮き彫りになります。
This guide is written for process, equipment, production, and purchasing leaders at coil slitting operations who need a defensible way to compare options, especially when a higher-priced knife set claims longer life. It’s also the kind of ROI conversation many teams have with suppliers like Maxtor Metal when they move into tighter edge specs, higher-strength grades, or higher line speeds.
If your operation uses roller shear equipment alongside rotary slitting, material selection logic, clearance engineering, and the failure mode diagnostics that directly affect knife ROI are covered in Maxtor Metal’s ロータリースリッターナイフおよびローラーシャー刃エンジニアリングガイド.
- Purpose: a data-driven procurement guide to model total cost of ownership and rotary slitter knife ROI.
- Audience: process, equipment, production, and purchasing leaders at coil slitting operations.
- Outcomes: a practical ROI model, material/coating selection logic, and procurement/QA checklist.
ロータリースリッターナイフのROI算定におけるTCO(総 ownership コスト)枠組み
Variables and assumptions
A knife ROI model only works if your variables match how your plant actually consumes knives. Keep the inputs simple at first and make the assumptions explicit.
Production and quality variables
- スループット: tons per hour, and planned tons per year per line.
- Edge requirement: target burr height (often tracked as a percentage of thickness in coil processing specs).
- Scrap and rework: scrap rate tied to edge condition (startup scrap, downstream deburr/edge conditioning, customer rejects).
Knife consumption variables
- Edge life: tons per grind (or hours per grind), by material grade and coil mix.
- Regrind count: number of safe regrinds before minimum diameter/thickness, or before edge geometry becomes unstable.
- Regrind cost: per knife, per set, or per lot.
- Knife failure mode: wear-out vs micro-chipping. (Chipping breaks models because life becomes non-linear.)
Setup and downtime variables
- 切り替え時間: minutes per knife swap, including setup verification.
- ダウンタイムコスト: use either contribution margin per hour or an agreed internal “lost production” cost per hour.
重要なポイント: A higher-priced knife only needs to win on one of four levers—edge life, regrinds, downtime, or scrap—to beat a cheaper baseline.
Cost-per-ton formula
Use a cost-per-ton structure so every stakeholder can compare apples to apples.
Let:
- P = purchase cost per knife set (or per pair) deployed on one line (USD/set or your local currency)
- G = regrind cost per cycle (USD/cycle on the same basis as P)
- N = total usable grind cycles (count; initial edge + regrinds)
- L = tons per cycle (tons/grind cycle)
- D = downtime minutes per changeover (min/changeover)
- C_d = downtime cost per hour (USD/hour)
- S = scrap/rework cost per ton attributable to knife wear or burr drift (USD/ton; delta vs baseline)
それから:
Knife cost per ton
- Tooling + regrinds:Knife cost/ton = (P + (N-1) × G) / (N × L)
- Downtime per ton:Downtime cost/ton = (D/60) × C_d × (1/L)
- Scrap/rework delta per ton:Quality cost/ton = S
Total cost per ton
TCO/ton = Knife cost/ton + Downtime cost/ton + Quality cost/ton
Simple ROI interpretation
To keep ROI from becoming subjective, compute the incremental tool spend per ton and compare it to the TCO savings per ton.
- Incremental tool spend per ton:
ΔTool spend/ton = (P_option + (N_option-1) × G_option) / (N_option × L_option) – (P_base + (N_base-1) × G_base) / (N_base × L_base)
- TCO savings per ton:
ΔTCO/ton = TCO/ton_base – TCO/ton_option
それから:
ROI ratio = (ΔTCO/ton) / (ΔTool spend/ton)
If you want a standards anchor for how materials and hardness are typically specified and verified, start with ISO 4957:2018 Tool steels and Rockwell hardness testing via ASTM E18.
Worked example (numbers for illustration only)
Assume one line uses a knife set with:
- P = $2,400/set
- G = $220/cycle
- N = 6 cycles
- L = 800 tons/cycle
- D = 50 min/changeover
- C_d = $900/hour
- S = $0.35/ton
- Tooling + regrinds per ton:
Knife cost/ton = (2400 + (6-1) × 220) / (6 × 800) = 3500/4800 = 0.729 USD/ton
- Downtime cost per ton:
Downtime cost/ton = (50/60) × 900 × (1/800) = 0.938 USD/ton
- Quality cost per ton:
Quality cost/ton = S = 0.35 USD/ton
Total:
TCO/ton = 0.729 + 0.938 + 0.35 = 2.017 USD/ton
You can now repeat the same math for an alternative knife set and compare TCO/ton directly, then calculate ROI using the TCO savings per ton divided by the incremental tool spend per ton.
Data capture plan
A good ROI model is mostly a measurement plan. If you only do one thing, stop relying on “we think it lasts about X coils.”
What to log per knife set
- Coil mix: material grade, thickness range, coating condition, average width and slit count
- Line speed and tension mode
- Tons to first burr drift, and tons to changeout
- Regrind count and removed stock per grind
- Setup readings: clearance/overlap target, spacer stack verification, and runout checks (for a structured logging format covering ISO fit class, TIR readings, and blue-check results, see the arbor fit and runout audit template
- Quality outcomes: burr height trend, width drift, edge wave, rejects
How to measure burr and edge condition
- For inline monitoring concepts, Micro-Epsilon shows typical approaches in burr measurement in slitting lines.
- For burr height definition and incoming inspection framing in shearing operations: use your machine OEM’s setup documentation and the burr acceptance criteria defined in your internal control plan or customer spec.
- For practical setup geometry and runout checks, use your machine OEM setup sheets and a repeatable inspection routine: verify arbor runout and parallelism, confirm spacer stack thickness, set clearance/overlap with a defined method, and validate burr height on a short verification coil before committing to a full run.
粉末ハイス(PM-HSS)vs 工具鋼の性能経済性(コストパフォーマンス)比較
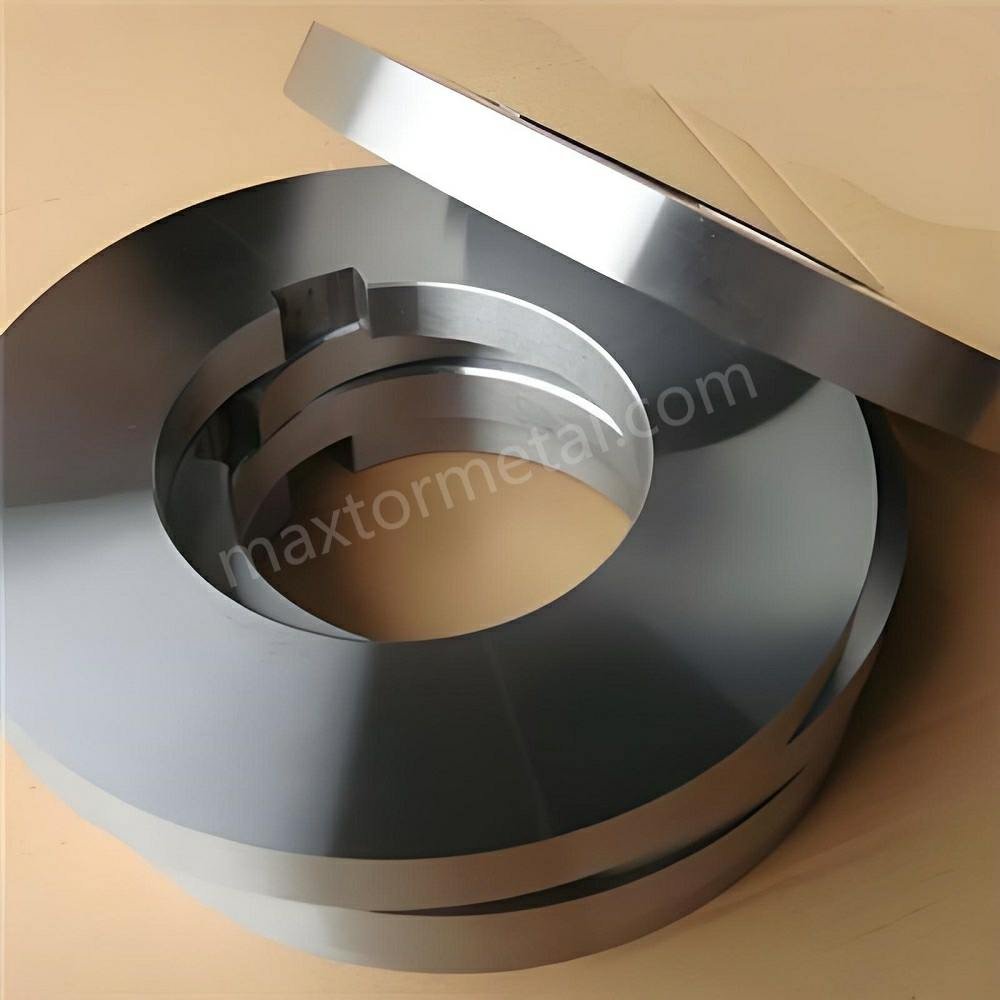
Metallurgy and mechanical properties
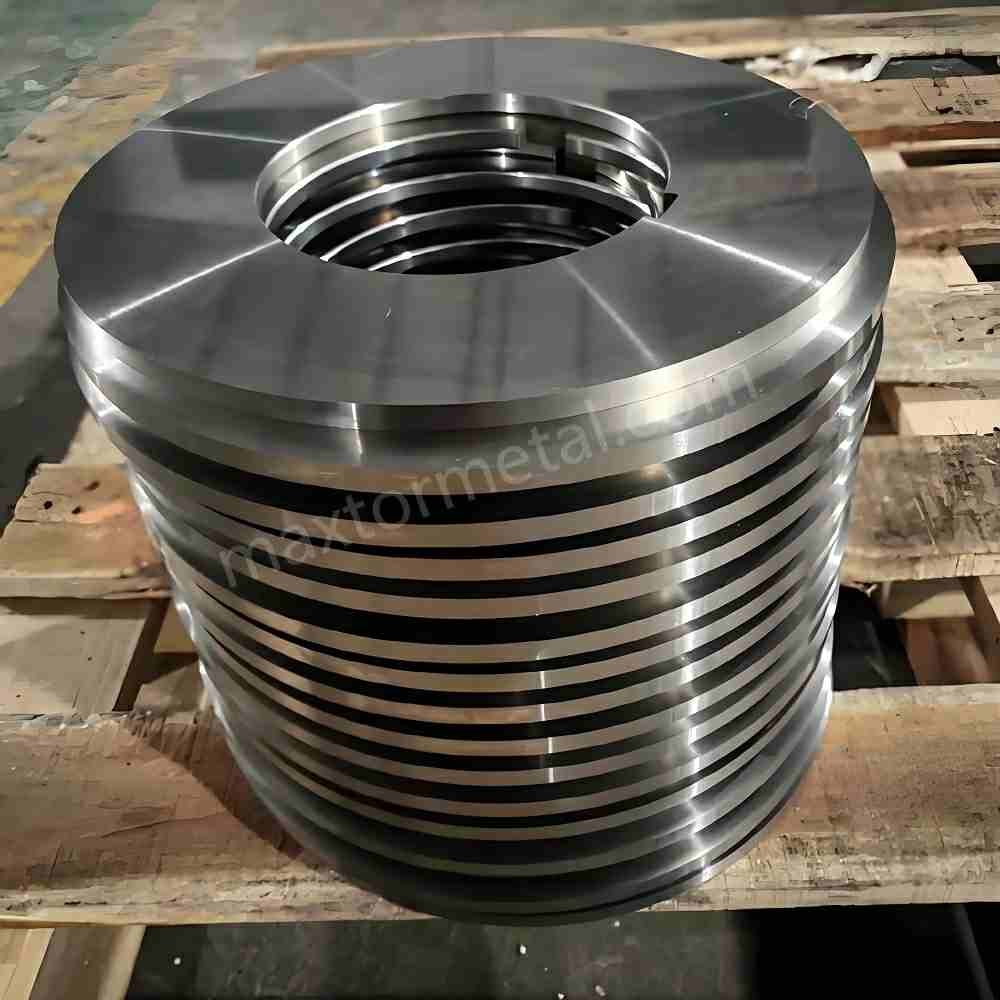
For procurement, the key point isn’t “which steel is better.” It’s which steel holds an edge in your wear mechanism without trading away too much toughness.
Tool steels used for rotary slitter knives (common examples: D2-type, DC53-type, other cold-work tool steels) are typically selected for a balance of wear resistance and toughness. They can be cost-effective when the failure mode is gradual wear and when your setup window is stable.
PM-HSS (powder metallurgy high speed steel) is chosen when wear resistance and hot hardness matter more—think higher speeds, tougher grades, higher temperatures at the edge, and environments where conventional carbide distribution can lead to uneven wear. ISO explicitly covers tool steels produced by powder metallurgy in ISO 4957:2018.
Hardness alone isn’t enough, but it is a check you can audit. Use Rockwell C methods per ASTM E18 to verify that delivered knives are in the requested range and consistent lot to lot.
Edge life and resharpen cycles
From an ROI view, PM-HSS earns its keep in two situations:
- It increases tons per grind without increasing burr drift.
- It increases the number of predictable regrinds before geometry or size becomes the limiting factor.
What breaks ROI models is micro-chipping or unstable edge wear. If your “better” knife chips early, the average edge life number becomes meaningless because one failure can force a line stop, re-thread, and scrap.
Practical way to compare options:
- Compare tons per grind (median, not just average).
- Compare variance (wide variance is expensive because it disrupts planning).
- Compare grind-to-grind consistency (does performance drop sharply after the first regrind?).
Coatings by material and speed
Coatings are not a blanket upgrade. They’re a friction and wear management tool. The coating that helps in thin, abrasive laminates may be wrong for thicker, higher-impact slitting.
When pickup/galling is a concern (common on certain stainless grades), it helps to frame it correctly: galling is a severe form of adhesive wear driven by metal-to-metal contact, pressure, and lubrication breakdown. The British Stainless Steel Association summarizes practical contributors in 「Factors affecting wear and galling” (BSSA).
A simple selection logic you can use in sourcing discussions:
- When adhesive pickup and galling drive quality loss (common on certain coated or tacky surfaces), prioritize low-friction coatings and a surface finish strategy.
- When abrasive wear dominates (hard coatings, high-strength grades, contaminated surfaces), prioritize wear-resistant PVD-type coatings but verify edge integrity after coating.
- When chipping risk dominates (setup variability, vibration, thicker gauges), treat coating as secondary to substrate toughness and edge geometry.
If you want a procurement-quality spec basis for HSS, separate “tool steel” from “high speed steel”: in ASTM’s framework, HSS is specified under ASTM A600 rather than ASTM A681.
刃先クリアランス、バリの発生、および累積公差(スタックアップ)の関係性
Burr mechanisms and control window
Burr is the symptom. The root causes are almost always a combination of clearance, overlap, rigidity, and stability.
You can use two practical rules of thumb to structure troubleshooting:
- If burr is uniform and gradually increasing, you’re probably looking at wear and clearance drift.
- If burr is periodic or intermittent, suspect runout, spacer damage, or machine alignment issues before you change clearance values.
For a full root-cause matrix across all six burr drivers—clearance, overlap, knife geometry, alignment, lubrication, and tension—with setup windows by material family and a step-by-step inspection protocol, see the Slitting Burr Reduction Handbook.
For industry framing on how setup geometry affects slit quality and knife life, a solid baseline is to use your slitter OEM documentation and internal setup sheets, then standardize how you verify clearance/overlap, arbor runout, and spacer condition before you adjust process settings.
For a practical, non-OEM baseline on why alignment and geometry control matter in rotating systems, Fluke explains shaft alignment tolerances and why they impact reliability—the same logic applies when arbor alignment and runout drive burr variance and unexpected changeouts. For a full treatment of how spacer face parallelism, rubber ring compression, and stack stiffness interact to hold clearance under dynamic load—including a case study with measured burr and knife life data—see 高精度スリッター用スペーサー&ゴムリング:組込み剛性、刃先クリアランス、およびTIR(総合振れ精度)の完全制御.
Precision targets for knives and spacers
Your knife steel choice can’t overcome a loose tolerance stack.
Targets that commonly matter in procurement and incoming inspection:
- Thickness tolerance and parallelism on knives and spacers (controls slit width repeatability)
- Bore fit and concentricity (controls runout under load)
- 表面仕上げ on knife faces (affects pickup and edge damage)
When a supplier quotes a premium steel but can’t provide stable thickness and runout inspection data, you’re not buying ROI. You’re buying uncertainty. For the specific bore fit classes, TIR acceptance tiers, and blue-check protocol that define “stable” in a spindle fit context, see the OEMスリッターナイフの図面:スピンドル嵌合監査、ISO公差、TIRゲート.
Setup verification and error-proofing
The fastest ROI wins often come from error-proofing, not metallurgy.
A practical setup verification routine:
- Clean and inspect spacers for nicks; verify stack thickness against target.
- Verify arbor runout and parallelism; document the “as found” state.
- Set clearance and overlap using a defined method, then run a short verification coil and measure burr.
- Lock the settings and record them as a setup sheet for the specific material family.
Teams that want a traceable, repeatable framework for this routine — covering ISO fit selection, dial-indicator sweep, and trial-slit confirmation — can use the spindle fit audit checklist as a starting template.
ROI予測モデルおよび感度分析(センシティビティ・アナリシス)
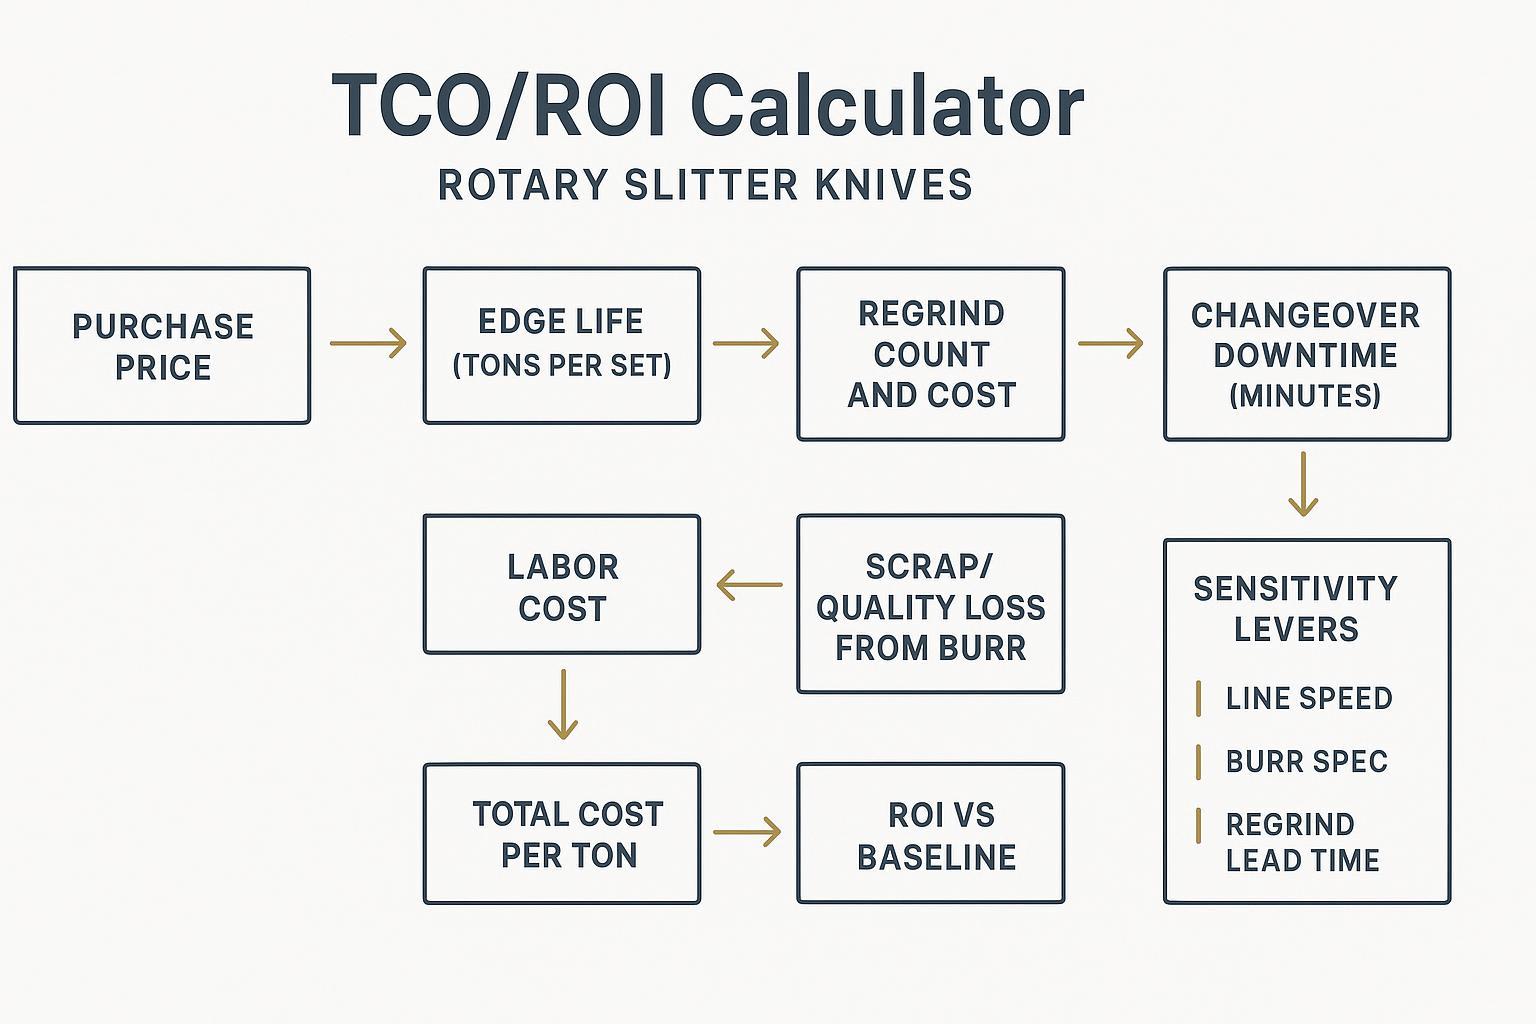
Baseline scenario and calculator layout
Start with your current “good enough” knife as the baseline and build the calculator in blocks so each department can audit their part.
Calculator blocks
- Tooling: purchase cost, regrind cost, max regrinds
- Performance: tons per grind by material family
- Changeovers: minutes per event, labor cost, opportunity cost
- Quality: scrap/rework delta from burr drift or width drift
If you want the calculator to survive a procurement review, show two things:
- Which inputs are measured vs assumed
- What happens when the assumptions are wrong
Sensitivity levers and break-even curves
In practice, break-even almost always hinges on one of these levers:
- Downtime cost per hour: if the line is capacity constrained, downtime dominates.
- Tons per grind: if your current knives are short-lived, small improvements pay back fast.
- Scrap and rework: if burr creates downstream work, quality dominates.
- Regrind logistics: long lead times force more spares and increase the risk of running dull tools.
Model each lever as a simple multiplier and build a one-page break-even view:
- x-axis: tons per grind improvement
- y-axis: TCO/ton difference
- curves: different downtime cost assumptions
Case-style examples across materials
Rather than fake numbers, use anonymized, range-based examples you can audit internally.
Measurement notes for interpreting case results
To keep comparisons reproducible, the cases below assume:
- Life is measured to a quality limit, not catastrophic failure (for example: burr limit as a % of thickness, or a downstream reject/SPC threshold).
- Sampling cadence is defined up front (startup check, then per coil or per tonnage interval).
- Variance is tracked (median + spread), because unpredictable early failures can erase the average-life advantage.
Case 1: AHSS/HSLA with tight burr requirements
Based on field service records aggregated across Maxtor Metal after-sales engagements (anonymized, range-normalized
Applicability: DP780–DP980 and HSLA 550–780 MPa, thickness 0.8–2.5 mm, manual changeover. Burr limit ~5–8%t. Changeout occurs when burr crosses the SPC control line (not when the knife catastrophically chips). Regrind restores a consistent edge geometry.
| 変数 | Baseline (conventional tool steel) | PM tool steel (observed change) |
|---|---|---|
| L (tons/cycle) | 350–700 | +40% to +100% |
| N (total cycles) | 4–7 | +2 to +4 cycles |
| D (min/changeover) | 40–75 | — |
| C_d (USD/hour) | 700–2,000 | — |
| S (USD/ton) | 0.30–1.80 | −0.15 to −1.20 |
| G (USD/regrind) | 20–45 | — |
| P (tool price multiplier) | 1.0× | test via sensitivity analysis |
Measurement sequence (example)
- Burr check at end of each coil (5 points per edge)
- Record cut-edge temperature and knife OD
- Changeout if burr exceeds the control line for two consecutive coils
- After each regrind, log cumulative metal removed
Operator behavior note (why process window still matters)
When PM steel was first trialed, operators reused the previous tool-steel clearance without adjustment. The first cycle showed localized edge polishing and only ~20% life improvement. After increasing side clearance by ~1–2% of thickness and re-calibrating knife overlap, life returned to >70% improvement.
Typical payback: 2–6 months; high C_d lines can be <1 month.
Case 2: Stainless with pickup/galling as the dominant failure mode
Based on field service records aggregated across Maxtor Metal after-sales engagements (anonymized, range-normalized
Applicability: SUS304 / 316L, thickness 0.5–2.0 mm, “no coating defect allowed” surface requirement. Failures are primarily driven by pickup/galling rather than abrasive wear.
| 変数 | Baseline (tool steel) | PM tool steel (observed change) |
|---|---|---|
| L (tons/cycle) | 220–480 | +30% to +80% |
| N (total cycles) | 4–8 | +1 to +3 cycles |
| D (min/changeover) | 35–65 | — |
| C_d (USD/hour) | 600–1,700 | — |
| S (USD/ton) | 0.15–1.00 | −0.08 to −0.60 |
| G (USD/regrind) | 22–50 | — |
| P (tool price multiplier) | 1.0× | test via sensitivity analysis |
Measurement sequence (example)
- Check for knife pickup each coil
- Record cut-edge Ra
- Inspect edge radius every 100–150 tons
- Stop production when scratches become continuous
Process limitation note
If lubrication conditions drift materially (e.g., emulsified coolant concentration drops), the PM advantage can shrink because galling is driven by friction conditions, not substrate alone.
If you want a technical anchor for how lubrication and surface condition change galling risk, TWI’s knowledge base covers the mechanics of galling and its surface contact drivers in a process-neutral format.
Operator behavior note
Early trials tried to “use all the PM life” by delaying changeouts. Once pickup started, surface scratches escalated quickly and the line had to stop anyway. Switching the changeout trigger to a quality limit (not a wear limit) reduced total TCO even if it meant leaving some theoretical knife life unused.
Typical payback: 4–9 months.
Case 3: Aluminum with high throughput and downtime-sensitive economics
Based on field service records aggregated across Maxtor Metal after-sales engagements (anonymized, range-normalized
Applicability: 1xxx / 3xxx / 5xxx series, thickness 0.3–1.5 mm, high-speed continuous production, automatic steering/alignment functioning normally.
| 変数 | Baseline (tool steel) | PM tool steel (observed change) |
|---|---|---|
| L (tons/cycle) | 900–2,000 | +20% to +55% |
| N (total cycles) | 6–10 | +1 to +3 cycles |
| D (min/changeover) | 25–50 | 0 to −10 min/changeover |
| C_d (USD/hour) | 900–2,800 | — |
| S (USD/ton) | 0.02–0.20 | −0.01 to −0.12 |
| G (USD/regrind) | 18–40 | — |
| P (tool price multiplier) | 1.0× | test via sensitivity analysis |
Measurement sequence (example)
- Runout check each shift
- Burr height recorded each coil
- Knife OD measured every two coils
- Total downtime recorded at each changeover
Process limitation note
Aluminum wear is often light, so scrap reduction from PM can be limited. ROI is usually driven by fewer stops, more stable setups, fewer mid-run compensations, and fewer unplanned changeovers.
Operator behavior note
Some crews perform preventive changeouts on night shifts, so actual life utilization may only be ~85–90% of theoretical. With PM, lower life variance often reduces “early preventive swaps,” cutting downtime by ~5–10 minutes per event.
Typical payback: 8–18 months; strongest on high-speed, high-volume lines with higher C_d.
Tip: These ranges can be plugged directly into the TCO variables (L, N, D, C_d, S, plus P and G) to produce a defensible TCO/ton band for procurement review.
Sensitivity analysis shortcut: keep the measured ranges for L, N, D, C_d, S, and G fixed, then rerun the calculator with P = 1.8×, 2.3×, and 2.8× the baseline tool-steel price to see how robust the break-even point is under different premium assumptions.
調達基準、品質保証(QA)、および研磨・メンテナンス等のサービスプログラム
Specifications and OEM compatibility
A procurement spec that drives ROI is clear on geometry and inspection, not just material name.
Include in RFQs:
- Knife OD/ID/thickness, tolerances, and parallelism requirements
- Bore fit class, concentricity/runout target, and how it will be measured
- Edge geometry: bevel angle, land, edge radius (and allowed change after regrind)
- Intended material families (steel, stainless, aluminum, coated) and thickness ranges
QA, traceability, and inspection
If your organization is audited (or your customers are), traceability is not optional. It’s how you keep knife performance from becoming a guessing game.
A practical QA package to request and retain (this is standard practice with suppliers such as Maxtor Metal, and it should be vendor-agnostic):
- Material certificate and heat/lot identification
- Heat treatment record and hardness map (multiple points; variability matters as much as the nominal)
- Dimensional inspection report for thickness, parallelism, bore, and runout
- Surface finish verification if your application is sensitive to pickup
- Regrind history log tied to the knife serial/lot
Hardness verification should reference the method (Rockwell C) per ASTM E18, and material specs can be tied back to ISO 4957:2018 where applicable.
QA documentation sample (what “good” looks like)
If you want incoming inspection to be auditable (and comparable across suppliers), a practical “minimum viable” record set for each knife lot is:
- 材料のトレーサビリティ: heat/lot ID + material certificate reference
- Heat treat record: target hardness range + actual readings by location (e.g., OD, mid-radius, near bore)
- Dimensional inspection: thickness and parallelism, bore size/fit notes, and runout/concentricity results
- Surface condition: face finish measurement or process note (when pickup risk is high)
- Regrind log: date, stock removed, post-grind thickness/runout check, and sign-off
You can turn the above into a one-page checklist so each receiving inspection is consistent:
- Lot/serial:
- Material spec:
- Hardness target / actual (min–max):
- Thickness (min–max):
- Parallelism:
- Bore:
- Runout/concentricity:
- Face finish:
- Regrind count / stock removed:
- Inspector + date:
Regrind, lead times, and inventory strategy
Regrind programs are where “cheap” knives often become expensive.
Build a simple inventory strategy:
- Define your minimum safe edge condition (burr threshold or tons limit) so operators don’t stretch tools unpredictably.
- Set a regrind trigger based on burr trend, not just calendar time.
- Keep enough spare sets to cover regrind lead time plus variability.
If you qualify a supplier regrind service (including Maxtor Metal’s regrind workflow when it’s available for your knife type), treat it like any other critical process:
- document the allowed stock removal per grind
- verify edge geometry restoration method
- require after-grind inspection reports for thickness and runout
結論
One-page summary: where PM tool steel tends to pay back
| シナリオ | Typical payback (from anonymized field ranges) | Dominant ROI levers | What to measure first |
|---|---|---|---|
| AHSS / HSLA with tight burr limits | 2–6 months (sometimes <1 month on high C_d lines) | Quality cost (S) + downtime (D, C_d) | Burr-to-limit trend vs tonnage, downtime minutes per changeover, scrap/rework delta per ton |
| Stainless with pickup/galling risk | 4–9 months | Quality variance (S) + predictability | Pickup/scratch rate, edge radius checks per tonnage interval, lubrication stability vs defect rate |
| Aluminum high-speed, high-volume | 8–18 months | Downtime and throughput (D, C_d, L) | Changeover frequency, total downtime per event, unplanned changeouts vs planned, tons per cycle stability |
Tip: If you want a quick robustness check, keep L/N/D/C_d/S/G ranges fixed and rerun sensitivity with P = 1.8×, 2.3×, and 2.8× baseline.
The ROI question isn’t whether PM-HSS is “better” than tool steel. It’s whether it changes the cost-per-ton equation in your line.
- Key takeaways: PM-HSS advantages, coating fit by material, and setup/tolerance priorities.
- Next steps: populate the ROI template with plant data and run sensitivity checks.
- Start collecting: burr height vs tonnage, edge life, changeover time, scrap, regrind counts.
FAQs:
Q: ロータリースリッターナイフの「トン当たりコスト(Cost per ton)」はどのように計算すればよいですか?
A: 次の3つの要素を合算するコストモデルを使用します:(1)「刃物購入費用+再研磨費用」を刃物の全寿命までの総生産トン数で割ったもの、(2)「1回あたりの刃物交換(段取り)に伴うダウンタイム損失」を交換インターバル間の生産トン数で割ったもの、(3)「バリの経時変化(バー drift)に起因するスクラップ・手直し損失の差分」。重要なのは、刃物の「寿命」を崩刃(破致命的な破損)に至るまでのトン数ではなく、必要な「製品端面品質を維持できる限界までの生産トン数」として定義することです。
Q: コイル割断用スリッターナイフに粉末ハイス(PM-HSS)を採用する価値はありますか?
A: 衝撃による「刃こぼれ(チッピング)」ではなく、「耐摩耗性の安定(1研磨あたりの生産トン数)」や「予測可能な再研磨サイクル」がボトルネックとなっている場合は、十分な価値があります。ただし、設備ラインに振動や芯ズレ、板厚の大きなバラつきがある場合は、まず組み込み精度(セットアップ・ウィンドウ)を改善してください。さもなければ、材質をアップグレードしてもデータ上の効果としては現れません。
Q: シャープな刃物(スリッターナイフ)を使用しているにもかかわらず、スリット加工中にバリが大きくなる原因は何ですか?
A: バリ発生の大部分は、クリアランスのズレ(クリアランス・ドリフト)、刃物のラップ量(噛み込み量)のエラー、スペーサー類の摩耗、またはアーバー(刃軸)の振れ(ランアウト)に起因します。バリが均一ではなく周期的に発生している場合は、クリアランス値を調整する前に、まず軸の振れやスタック(組み込み)状態を確認してください。
Q: スリッターナイフの品質保証(QA)およびトレーサビリティ文書(パッケージ)には、どのような内容を要求すべきですか?
A: 最低限として次の項目が必要です:ロットID付きの材料証明書(ミルシート)、熱処理記録、多点硬度測定結果(ASTM E18準拠のロックウェルC硬度 HRC)、寸法検査(厚み/平行度/内径/振れ)、およびシリアル番号またはロットに紐づいた再研磨履歴。これらを入手することで、現場での刃物寿命(パフォーマンス)と、管理可能な製造変数との相関関係を正確に把握できるようになります。
Q: ロータリースリッターナイフは何回くらい再研磨が可能ですか?
A: 許容される最小外径・最小厚み、刃先形状(幾何構造)の要求仕様、および1回の研磨における研ぎ代(削り幅)によって異なります。再研磨ごとの研ぎ代をログとして追跡し、刃先形状が不安定になったり、バリの制御能力が低下したりする前に使用を中止してください。
Q: ロータリースリッターナイフは何回くらい再研磨が可能ですか?
A: コーティングは主に摩擦、熱、および摩耗モードを変化させます。被削材の溶着(ピックアップ)を低減し、アブレシブ摩耗(引っかき摩耗)を遅らせる効果はありますが、不適切なセットアップや設備剛性の低さに起因する「刃こぼれ(チッピング)」を解決することはできません。加工材の鋼種グループとライン速度に応じてコーティングを評価し、処理後の刃先品質(エッジ・インテグリティ)を必ず検証してください。
Q: 刃物の材質を変えずに、スリッターナイフの投資対効果(ROI)を最も早く向上させる方法は何ですか?
A: 製造バラつき(ばらつき)を抑えることです。具体的には、スペーサーの検査を標準化し、軸の振れ(ランアウト)を検証し、被削材の鋼種グループごとに再現可能なクリアランス/ラップ量の設定手順を確立してください。予期せぬライン停止(非計画的な刃物交換)を1回減らす方が、中途半端に鋼種をアップグレードするよりもはるかに大きなコスト回収につながります。
このROIおよびTCO評価フレームワークは特定のサプライヤーに依存しない中立的なもの(supplier-neutral)であり、御社独自の生産ラインの実測データや点検記録を用いて、すべての適格な刃物メーカーを客観的に評価するためにご活用いただけます。
著者
ジェリー・チュウ — Technical Support Specialist, After-sales Service, Maxtor Metal
Jerry has 10 years of cross-industry application experience in cutting and slitting (paper converting, plastics recycling, metal coil slitting, and wood processing). His after-sales work at Maxtor Metal focuses on translating field troubleshooting data into cost-per-ton comparisons — helping process and procurement teams build defensible ROI cases when evaluating knife material, coating, and regrind program changes.
Certifications: PMP, CMRP

 English
  Spanish
  Italian
  French
  Portuguese
  Russian
  German
  Arabic
  Hindi
Hindi  Vietnamese
  Indonesian
  Japanese
  Korean